
By Ken Mankoff
In July and August 2013 I was fortunate enough to join Fiamma Straneo, Hanumant Singh, and Sarah Das in Greenland as operator of the JetYak (a remote-controlled jetski-powered kayak). This past week we got our first look at the data. Unfortunately, the scientific cycle is slow, and a lot more data cleaning, processing and analysis needs to be done, then writing, submitting, and publishing, so it will be quite some time until final results are available to the community. This blog cannot shorten the time required for cleaning, processing, and analysis, but one of its purposes is to, on occasion, shorten the writing, submission, and publication portion of the cycle. Therefore, this post presents an initial look at some JetYak data.
I want to be clear that we have no results yet. There is a difference between “data” and “results” and what we achieved last week is an initial view of the data. We consider this an engineering success – numbers came back that appear, initially, when viewed on the screen, to make sense. There is much work to be done to turn these data into results that can have a scientific interpretation.
The best thing about these initial data is that the JetYak has proven itself a novel low-cost platform able to collect polar oceanographic and glaciological data at the ice/ocean boundary. This region is undergoing intense focus due to its importance with respect to ice sheet mass balance, and we now have demonstrated a platform that can collect critical data without putting humans at risk.
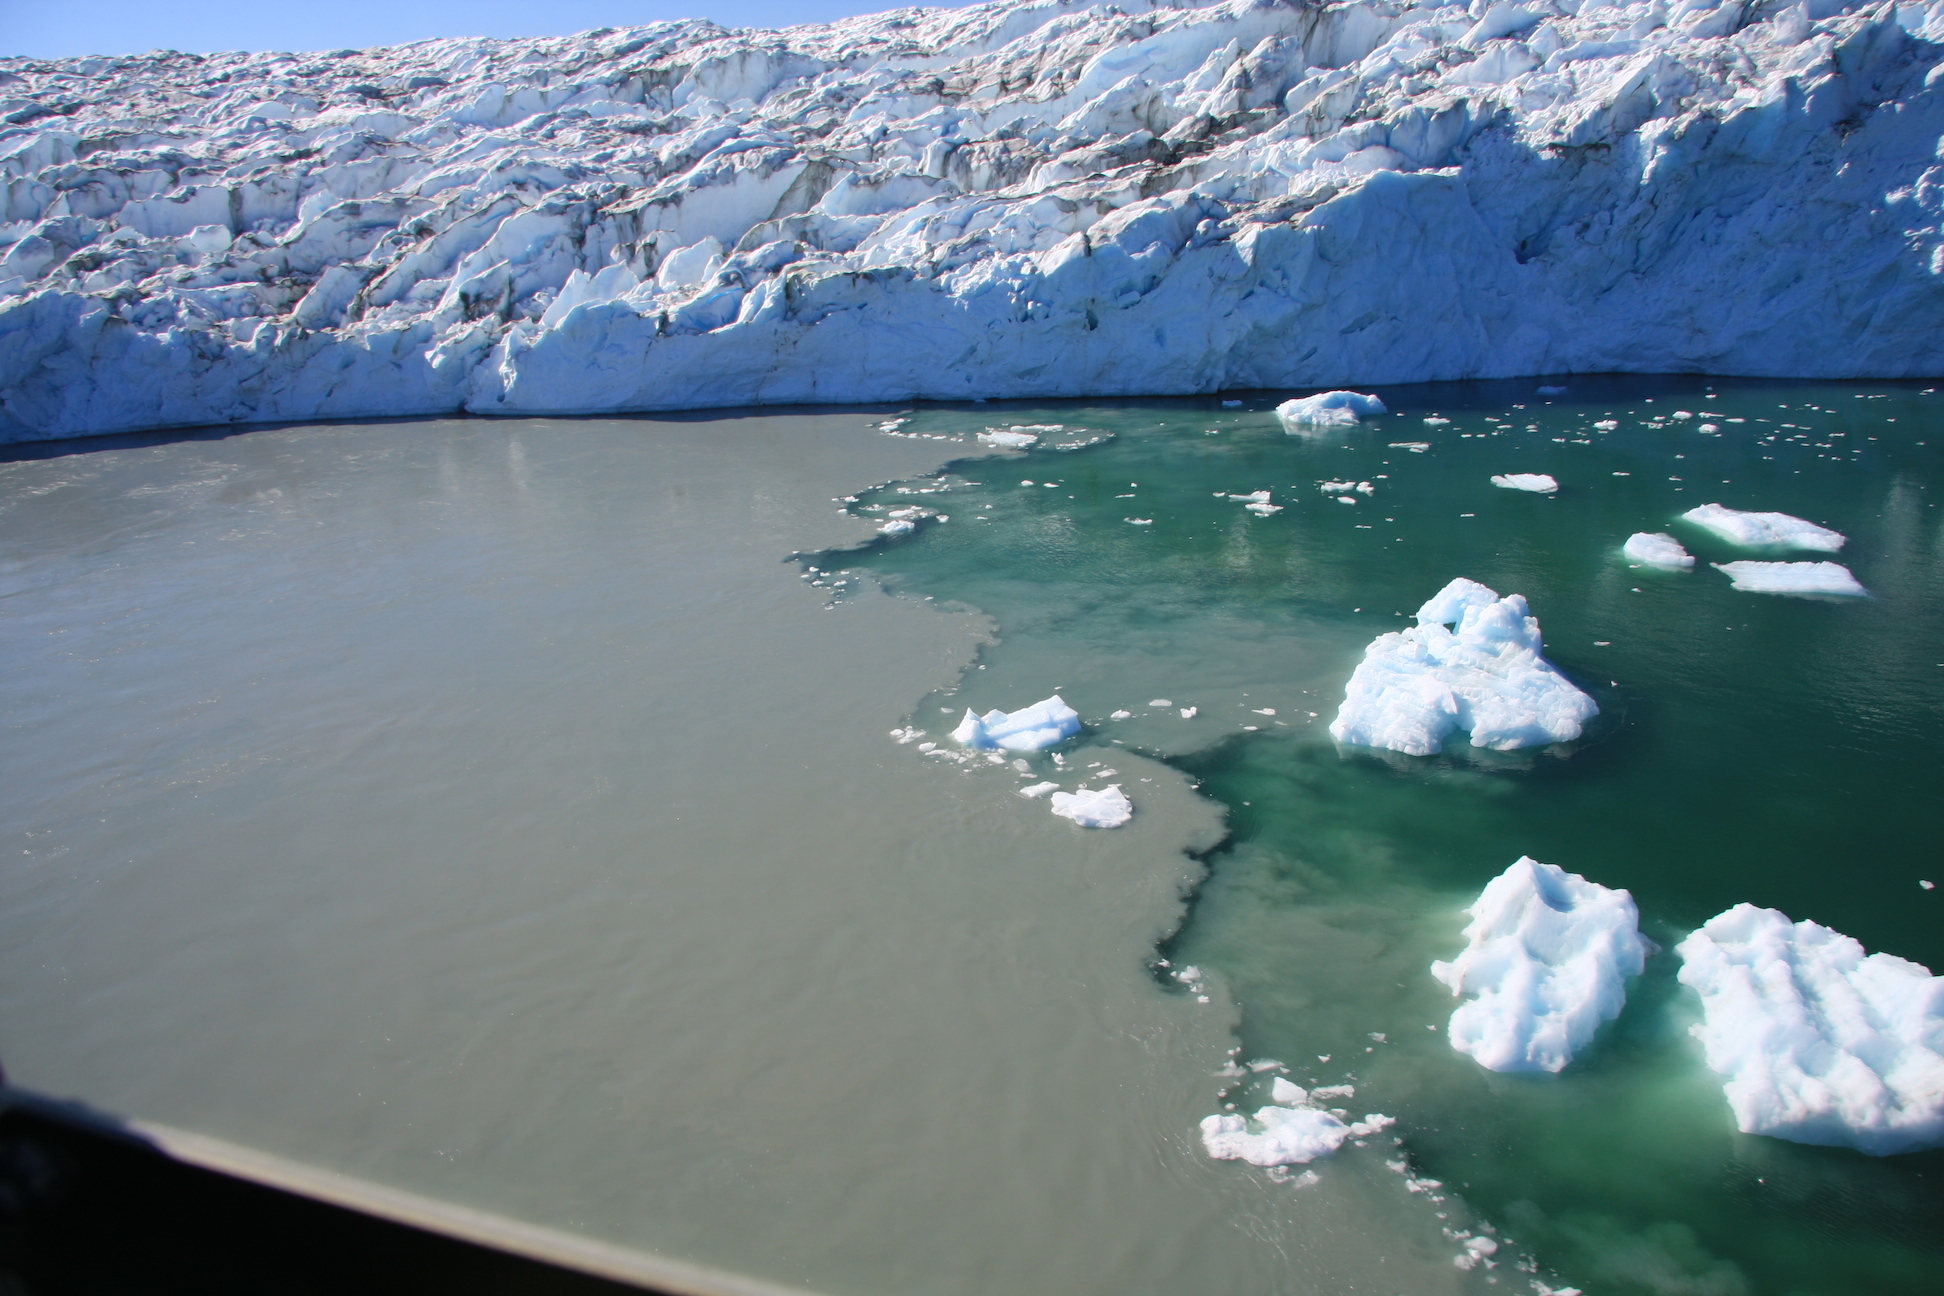
Subglacial outflow plume. Photo by Clark Richards.
Our field site is the boundary of the glacier front in Sarqardleq fjord, West Greenland. Specifically, the sediment-laden muddy sub-glacial outflow plume rising up the glacier face as one half of the ice/ocean boundary. Submarine melting, calving, and heat transfer to the front of the glacier is controlled by this plume. Yet collecting data in this location is dangerous and difficult due to the towering glacier ice frequently calving into the fjord. To understand processes acting on this boundary, Hanu outfitted a JetYak with oceanographic instruments. In addition to making oceanic/hydrologic measurements directly in the subglacial outflow plume, a laser mapped the aerial ice front, a sonar mapped the sub-aqueous ice front and bottom bathymetry, an acoustic doppler current profiler (ADCP) measured currents, and a conductivity depth temperature (CTD) sensor measured physical properties of the water.

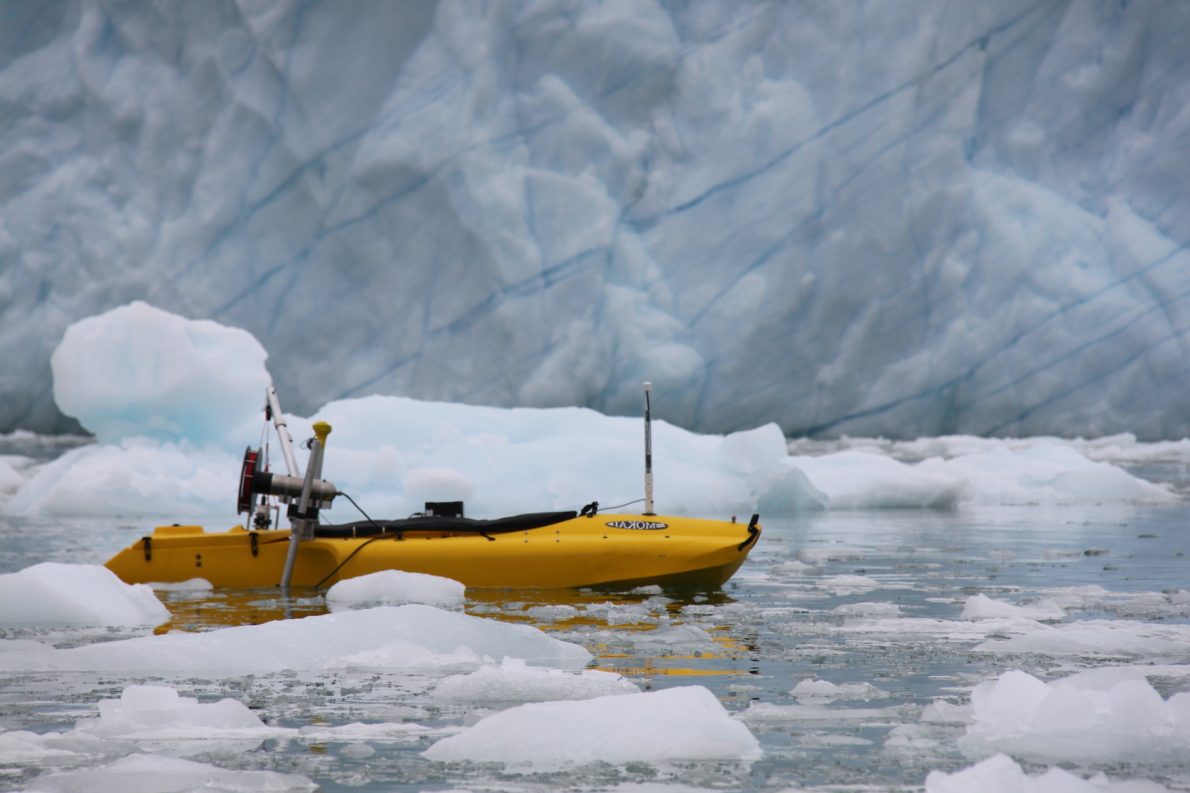
JetYak sailing among bergy bits in front of a glacier.
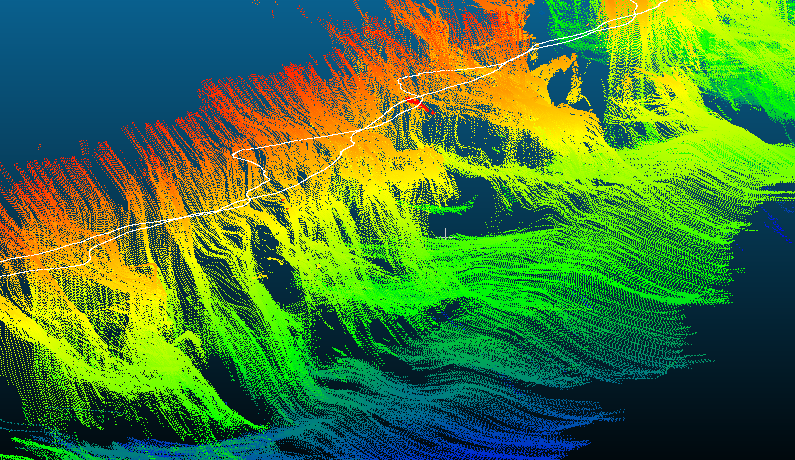
Last week we completed initial processing of the multibeam data providing a 3D view of the bathymetry and ice front. We have the entire ~5km fjord width of the ice face mapped, and much of the bathymetry at the bottom of ice front. As I said above this is data, not results, so there is not much to say about it, but the images below show some 3D views of the data.

JetYak MultiBeam – Overview plan (looking down) showing approximately 2 km of multibeam swath map.

JetYak MultiBeam – Context view showing sediment floor and ice front. Color is bathymetry, with blue deep, greens middle, and reds shallow (the ice face just under the water line).
JetYak MultiBeam – Zoom showing detailed view of bathymetry (horizontal) and ice front (vertical).
Next steps are to grid this (I plan to use the points2grid utility) and bring in several other bathymetric measurements both along the JetYak track to compare against our multibeam measurements, and elsewhere in the fjord to fill in the gaps. Finally, much cleaning needs to be done to remove outliers. Then we will have an initial result – a map of the fjord bathymetry and ice front. Next, we can begin to ask questions and seek answers. For example features such as bathymetric bumps may be pinning points for the glacier, paleo-plume deposits, or paleo glacial moraines. Our direct measurement in the plume may tell us about the velocity, turbidity, mixing scale, and temperature of the subglacial outflow.
For now this project is still in its exploratory phase. We are not seeking specific results, but rather trying to examine the data with an open mind to learn what insights are for now hidden in it. When we have more formal results, we will announce them here and via standard scientific publications too.