
The melting of icebergs beneath the ocean’s surface, or submarine melting, occurs continuously as the submerged portion of the iceberg is exposed to relatively warm ocean waters. Although the contrast in temperature and salinity between the ice and surrounding water is the primary driver of melting, melt rates are also influenced by the size and shape of icebergs and by the ocean properties. Conceptually, melting is associated with rising plumes (similar to smoke stacks) of melt water which are fresher and therefore lighter than the surrounding ocean water. For the most part, our understanding of how melting is influenced by variations in ocean properties, iceberg depth, and melt water plume strength is based on numerical models of simplified systems.
As described in several previous posts, it is exceedingly difficult to collect measurements of water properties in iceberg-choked fjords. Our understanding of ‘typical’ characteristics is therefore based on surveys conducted in only a handful of fjords around Greenland, typically in summer. Even where these observations have been collected, we can really only say something about the fjord characteristics where and when the surveys were conducted. So really we have two problems in estimating melt rates of icebergs: we have a very limited understanding of variability in ocean properties within/between glacial fjords and we don’t have a very good model to estimate iceberg melting even when/where we know the ocean properties.
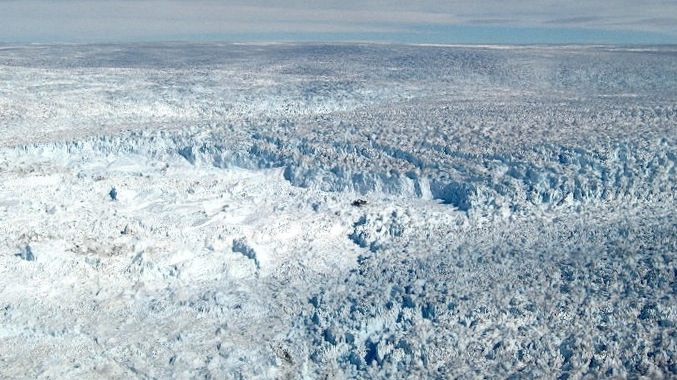
Terminus of Jakobshavn Isbræ, West Greenland, draining into Ilulissat Fjord. The fjord is choked by a dense blanket of icebergs and smaller bergy bits, called mélange. The ice (blue colors) is flowing from right to left into the fjord (white colors). Photo by Ellyn Enderlin
Many of the same factors control melting of glacier ice before and after it calves from a glacier terminus so we can look at estimates of glacier melt to get an idea of how iceberg melt varies in space and over time, and vice versa. Estimating the melt rate along the submerged portion of a glacier is, however, far from trivial and each estimation technique has its own limitations. Different techniques have been applied to the two main types of marine-terminating glaciers: glaciers with floating ice tongues and tidewater, or grounded, glaciers. For glaciers with floating ice tongues, which are found throughout Antarctica and in the high Arctic (mostly northern Canada & Greenland), observations of ice thickness, speed, and width obtained using satellite and/or aircraft-based sensors can be used to estimate melting beneath their floating section(s). The approach is to calculate the volume flux of ice entering the floating section and the volume flux of icebergs that break-off (calve) from the glacier. If we can also estimate surface melting across the floating ice tongue using weather observations or numerical models, we can calculate submarine melting by doing some basic accounting: the sum of all the outputs (calving, surface melting, & submarine melting) must be equal to the input (ice flux from inland). If we know the influx, the calving flux, and surface melting, then we can calculate submarine melting as: submarine melting = influx – (calving + surface melting). For grounded, tidewater glaciers, estimating melt rates is a bit trickier because we can’t use the accounting approach (on average: input = calving).
In the case of tidewater glaciers, we may be able to use observations of iceberg melting to tell us something about variations in glacier melting. Away from any region where submarine melting is controlled by the discharge of surface melt at the base of the glacier, we expect glacier melting to be similar to that of the nearby icebergs. This is especially true during the non-summer months (~October to April in Greenland), when discharge of surface melt at the base of glaciers is zero and glacier and iceberg melt rates should be approximately equal.
In order to estimate the melt rate of icebergs, and potentially of their nearby source tidewater glacier(s), I have been measuring changes in iceberg surface elevations over time using digital elevation models (elevation maps or DEMs for short). The DEMs are constructed using ~0.5 m-resolution stereo images collected by the WorldView satellites. Stereo images are two images of the same area that are taken from different angles. You can create DEMs from stereo images using computer programs that calculate the distance of objects in the images from the satellite by basically performing the same steps as your brain when you look at an object with both your eyes open. If you can identify the same iceberg in DEMs from two different dates, you can measure the change in surface elevation between those dates. The measured elevation change can then be converted to a melt rate by making some basic assumptions about the ice and water densities and the shape of the iceberg. DEMs containing the same icebergs on two different dates are shown below.
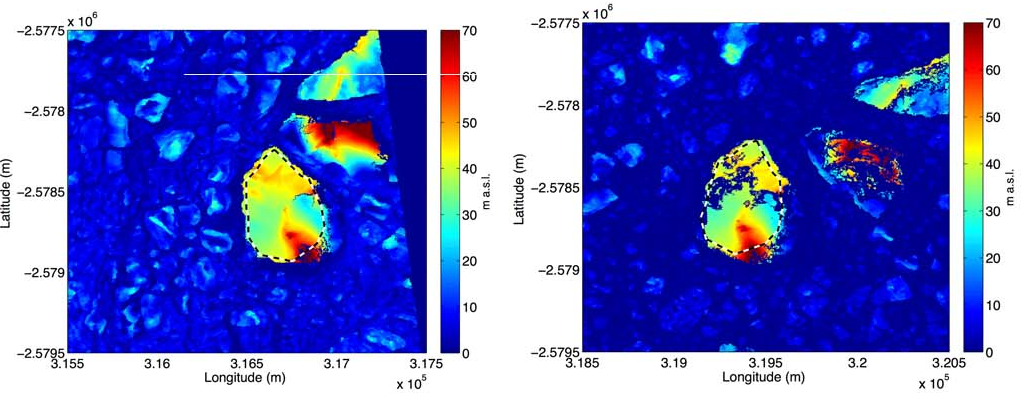
Sermilik Fjord DEMs for (left) 24 June and (right) 29 June 2012. The DEMs are cropped to focus on the iceberg delineated with the black-and-white dashed polyline. Elevations in meters above sea level are distinguished according to color. Large icebergs are shown as warm colors. Bergy bits are light blue and the ice-free fjord areas are dark blue. Dark blue colors within the icebergs are data gaps.
I am working on estimating iceberg melting in Greenland’s major glacial fjords as part of my postdoctoral research with Gordon Hamilton at the University of Maine Climate Change Institute. So far I’ve estimated iceberg melt rates in Sermilik and Ilulissat Fjords in East and West Greenland, respectively, and found some interesting results. Just as you may have observed when adding ice cubes to drinks, the freshwater flux from icebergs increases with the submerged surface area (smaller ice cubes dilute your drink faster). Summer melt rates are similar in both fjords (~0.3-0.4 m/d) despite differences in water temperature of ~1°C but winter melt rates are much lower (~0.1 m/d) in Ilulissat Fjord. Winter melt rates cannot be calculated for Sermilik Fjord and the winter decrease may be unique to Ilulissat Fjord, but needs to be investigated further. Through collaboration with Fiamma Straneo and Claudia Cenedese, I hope to provide the first detailed analysis of spatial and temporal variations in iceberg submarine melting in these fjords and possible explanations for the observed variability. The method used to estimate melting is described in detail in an article currently in review with the Journal of Glaciology and I hope to submit an article comparing iceberg melting in the two fjords in the next month.