
Last post Nat introduced the concept of computer code as a tool for scientists (including oceanographers), and highlighted the IPython Notebook — one of the recent steps along a path toward more open and reproducible research.
As a user of the R software environment1 (which was featured in a recent Nature article), I thought it would be interesting to present one of the solutions the R community has developed for making analyses more open and reproducible — dynamic documents. A dynamic document is a report that combines both text and code in a way that integrates them together seamlessly and produces a final document that includes the results of the code. Historically, such documents in R have been only available to those who write documents using LaTeX through a system known as Sweave, but recent interest in reproducible research has led to an expansion of the concept to include documents in almost any desired output format (including html, pdf, MSWord).
The backbone of the dynamic document system in R is based on Markdown — a simple-to-use and simple-to-read mark up syntax for plain text. For new users, I recommend the RStudio program, which allows for quick and easy creation of Rmarkdown documents, and provides extensive examples and help (RStudio is also a great environment for new users to R, especially because it provides an environment similar to the Matlab GUI).
The power of dynamic documents is that the results included in the document, including numerical results and figures, are guaranteed to be consistent with the code that generated them, because that code is also a part of the document. This eliminates a common issue in report/paper writing (that anyone whose ever written a paper can relate to), where a quoted numerical result or plot needs to be updated in the report each time the code that produces it is changed.
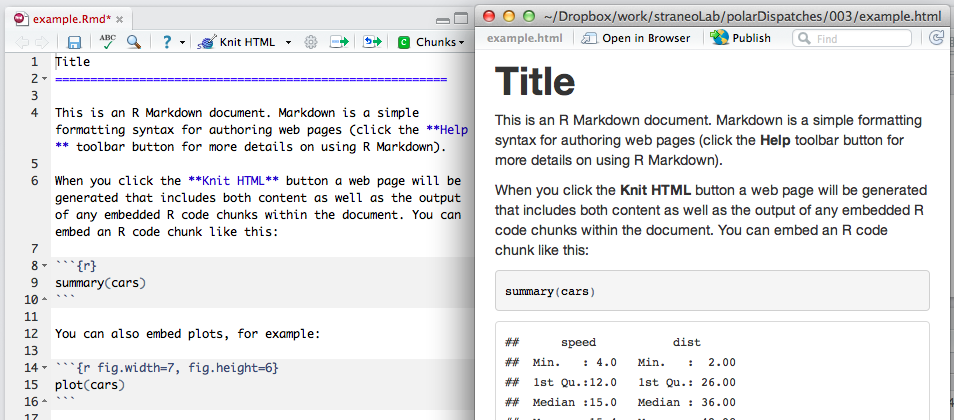
I won’t elaborate on the specifics and the syntax of Rmarkdown documents — there are plenty of examples on the web that do this already (check out Rpubs). The latest version of RStudio provides an example, the source of which is pasted below, that demonstrates the input/output of an Rmarkdown document, which can be converted to various formats:
Title
========================================================
This is an R Markdown document. Markdown is a simple formatting syntax for authoring web pages (click the **Help** toolbar button for more details on using R Markdown).
When you click the **Knit HTML** button a web page will be generated that includes both content as well as the output of any embedded R code chunks within the document. You can embed an R code chunk like this:
```{r}
summary(cars)
```
You can also embed plots, for example:
```{r fig.width=7, fig.height=6}
plot(cars)
```
Resources:
- Nature Article: “Programming tools: Adventures with R”
- Introduction to Rmarkdown: http://rmarkdown.rstudio.com/
- The `knitr` package in R: http://yihui.name/knitr/
- ROpenSci blog: Reproducible research is still a challenge
- a post for another day could detail why I switched to R from Matlab, which is currently the most commonly used analysis environment in physical oceanography. Feel free to ask me about it!